Professional Project: Software Engineer Co-Op·Ribbon Communications·Sep 2025 — Dec 2025
Autonomous SRE Agent System
AI-Driven Fault Detection, Localization, and Mitigation on Kubernetes
< 30s
Failure detection latency
15+
Fault scenarios simulated
4-phase
Autonomous OODA loop
Overview
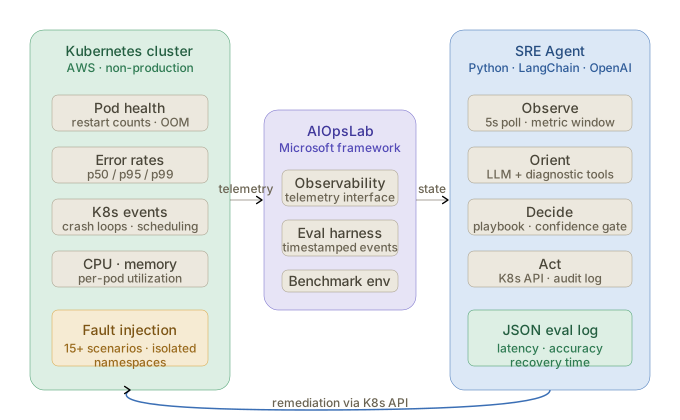
At Ribbon Communications, I built an agentic AI system for Site Reliability Engineering that autonomously detects failures in a cloud-native microservice environment, localizes the root cause, and initiates mitigation, before a human is paged.
Two coupled deliverables: the agent, and a chaos-engineering fault injection framework to evaluate it (simulating failures, measuring detection latency, validating diagnoses against ground truth). The agent achieved sub-30-second detection across all tested scenarios, and the framework outlived my co-op as a team asset.
The Problem
SRE at scale is a reaction-time problem. When a microservice fails, every second until detection is degraded service and every second after is user impact. Traditional SRE keeps a human in the loop (dashboards, paging, diagnosis, remediation), and even with great tooling that loop takes minutes. For a telecom company like Ribbon, where service continuity is contractual, that's unacceptable.
An autonomous agent compresses the loop to seconds with no human in the critical path. The hard part is reliability: a false positive (mitigating a healthy service) can do more damage than the failure, and a misdiagnosis triggers the wrong fix. It must be right, not just fast.
Goals
- Detect failures in a Kubernetes environment within 30 seconds of onset.
- Integrate with Microsoft's AIOpsLab as the observability and evaluation substrate.
- Build a fault injection framework simulating 15+ scenarios in isolated namespaces, doubling as the agent's testing ground and a team resource.
- Validate detection latency, classification accuracy, and self-healing across all fault types.
- Guarantee zero production interference via isolated namespaces and guard rails.
Technical Architecture
Agent Design: Observe, Orient, Decide, Act
The agent runs a continuous loop mirroring the OODA cycle.
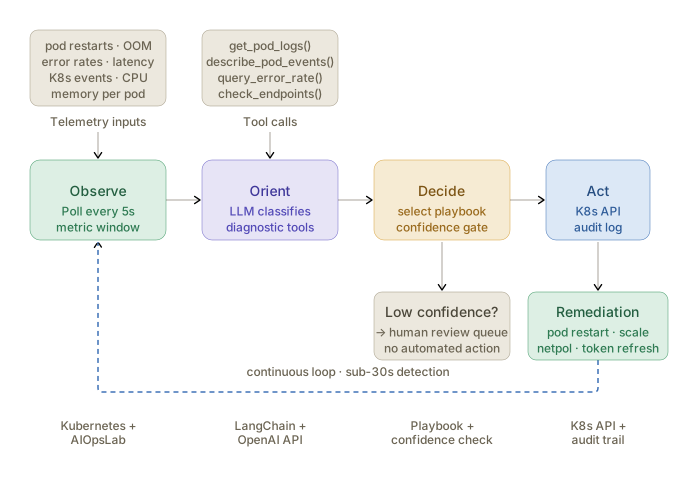
Observe. The agent polls cluster telemetry through AIOpsLab: pod health, restart counts, per-pod CPU/memory, inter-service error rates, latency distributions (p50/p95/p99), and Kubernetes event logs (crash loops, OOM kills, scheduling failures, node pressure). The interval is tuned to the 30-second target, with windowed aggregation filtering noise.
Orient. Telemetry feeds an LLM-backed reasoning layer built with LangChain. From a structured snapshot of system state (telemetry, recent events, dependency graph), the model classifies the failure: pod crash, network degradation, auth failure, or resource exhaustion. As a tool-use agent, it invokes diagnostic tools first: get_pod_logs, describe_pod_events, check_service_endpoints, query_error_rate. Grounding in cluster data cuts hallucination.
Decide. The agent selects a remediation from a playbook mapping failure types to actions:
| Failure Classification | Remediation Action |
|---|---|
| Pod crash loop | Restart pod, analyze logs for root cause signal |
| Authentication token expiry | Trigger token refresh procedure for affected service |
| Memory exhaustion (OOM kill) | Scale up pod memory limits, alert for capacity review |
| Network partition / packet loss | Reroute traffic via healthy endpoints, quarantine affected node |
| Service dependency timeout | Enable circuit breaker, redirect to fallback service |
| Disk pressure on node | Evict low-priority pods, trigger volume cleanup |
Before acting, it runs a confidence check: if confidence (the consistency of diagnostic tool outputs) is below threshold, the anomaly routes to human review.
Act. Remediations execute through the Kubernetes API (pod restarts, resource limit updates, replica scaling, network policy changes), each logged with a full audit trail: timestamp, anomaly, classification, confidence, action, and post-action health check.
AIOpsLab Integration
Microsoft's AIOpsLab provides a standardized interface for injecting workloads, observing behavior, and measuring responses, keeping evaluation rigorous: detection latency is measured from fault injection to first diagnostic action via its timestamped event log, not wall-clock estimates. It also ships a multi-service benchmark the framework targets.
Fault Injection Framework
A Python harness with two purposes: giving the agent realistic failures to detect, and giving the team a reusable tool for testing future reliability work against a controlled set.
Scenario Library
15+ parameterized scenarios in four categories:
Pod-level faults: pod crash (kubectl delete pod), crash loop (repeated restart with backoff), OOM kill (resource limit reduction), image pull failure (corrupt image reference).
Network-level faults: inter-service packet loss (network chaos tooling on cluster interfaces), latency spike (artificial delay on service calls), network partition (policy rules blocking service pairs), DNS resolution failure (CoreDNS manipulation).
Authentication faults: JWT token expiry (clock skew causing validation failures), invalid credential propagation (secret rotation with stale references), service account permission revocation.
Resource faults: CPU throttling (cgroup limit reduction), disk pressure (volume fill), replica scale-down (replicas forced below minimum viable count).
Each scenario is a repeatable one-command script against a target service, with configurable duration and intensity. It auto-tears-down the fault and verifies a healthy baseline before completing.
Safety Architecture
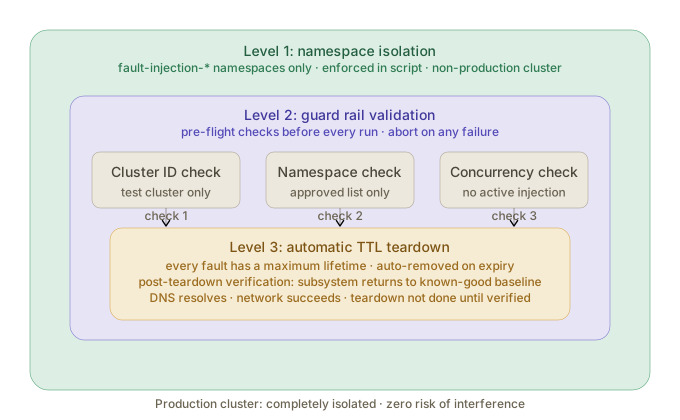
The non-negotiable constraint: it must be impossible to affect production. Three levels enforce it.
-
Namespace isolation. All runs execute only within dedicated
fault-injection-*namespaces in a separate non-production cluster. Scripts refuse to run if the target namespace doesn't match the approved pattern, enforced in code, not docs. -
Guard rail validation. Before injecting, the framework verifies the target is the designated test cluster (a known cluster ID), the namespace is approved, and no other injection is active. Any failed check aborts.
-
Automatic teardown. Every fault has a maximum TTL; if neither the agent nor the engineer terminates it, the framework removes it on expiry, so no fault state is orphaned.
Evaluation Harness
Per run, the framework measures:
- Detection latency. Fault injection to first diagnostic action (millisecond precision, from AIOpsLab event logs).
- Classification accuracy. Whether the stated root cause matches the injected fault type (against ground truth).
- Remediation correctness. Whether the chosen action matches the expected one.
- Recovery time. Agent action to cluster health restoration.
Results write to a structured JSON log per run, with an aggregate per batch.
Key Technical Challenges
Challenge 1: Balancing Detection Speed Against Classification Quality
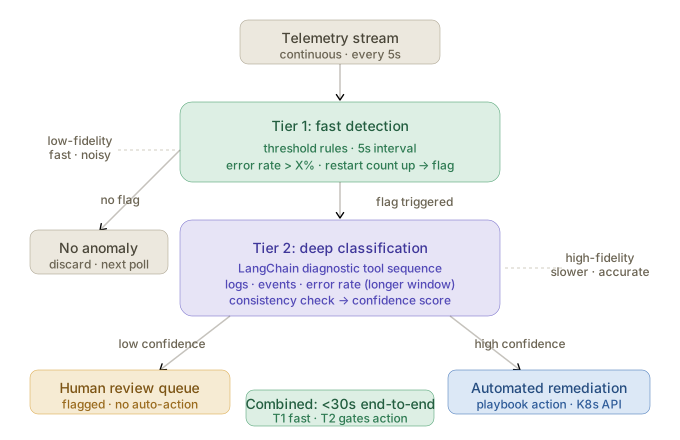
The 30-second target was in tension with accuracy: faster polling catches failures sooner but yields noisy telemetry; slower polling is cleaner but adds latency. The first implementation (fixed 5-second interval, no aggregation) hit the target but had an unacceptable false positive rate, misclassifying transient CPU spikes as exhaustion.
The fix was a two-tier detection architecture. Tier one runs every 5 seconds on threshold-based detection (error rate over X%, rising restart counts) to flag fast. Tier two fires on any flag and runs the full LangChain diagnostic sequence (logs, events, error rates over a longer window) before classifying. Fast feeding thorough hits the target without sacrificing accuracy.
Challenge 2: Preventing the Agent from Acting on Bad Diagnoses
An agent that can restart pods, change resource limits, and rewrite network policies is dangerous on a wrong diagnosis: a misclassified auth failure restarting a healthy service is an outage, not a fix.
The confidence threshold scores each classification by cross-referencing diagnostic tools. When pod logs, error-rate queries, and Kubernetes events agree, confidence is high; when they disagree (logs suggest OOM but memory metrics are normal), it's low and the anomaly routes to human review. Making outputs comparable was the hard part, since logs are text and metric queries return timeseries: the check compares the failure type each output implies, mapped to a fixed taxonomy, not the raw outputs.
Challenge 3: Building Fault Injection That Doesn't Break the Thing It's Testing
The framework had to be aggressive enough for realistic failures but safe enough to run blind. The three-level safety architecture covers production risk, but a subtler problem remained: a fault left running too long could corrupt test-environment state for later runs, e.g. an unreverted DNS manipulation breaking name resolution.
So each scenario's cleanup goes beyond reversing the injection: it validates the affected subsystem is back to a known-good baseline before teardown completes. DNS faults re-query the name; partitions confirm requests succeed.
Outcome and What It Demonstrates
The agent hit sub-30-second detection across all 15+ scenarios, the primary target. Classification accuracy was high for pod-level and authentication faults; network-level faults varied more, since packet loss and latency spikes look similar at the metrics layer, and the confidence threshold correctly routed those ambiguous cases to review. The framework was recognized in review as a significant team contribution, became the standard tool for testing reliability work, and outlived my co-op.
What the project demonstrates:
Autonomous AI Agent Architecture. A closed-loop observe-reason-decide-act system with explicit confidence gating before any irreversible action: the pattern behind production AI agents, not a chatbot with tools.
Production Safety Engineering. Isolation enforced in code, guard rails on every run, TTL-based teardown, and post-teardown verification: tooling safe to operate, not just documented as safe.
LLM Integration at the Infrastructure Layer. Most LLM integrations live at the application layer; here the model makes decisions that directly affect Kubernetes workloads, which meant designing the tool schema, confidence mechanism, and consistency check around where AI judgment holds.
Chaos Engineering Rigor. Measurable, reproducible scenarios with a structured evaluation harness: the difference between ad-hoc testing and systematic validation.
Tech Stack Summary
| Layer | Technology |
|---|---|
| Agent Language | Python |
| Agent Framework | LangChain |
| LLM Provider | OpenAI API |
| Observability & Eval | Microsoft AIOpsLab |
| Container Orchestration | Kubernetes |
| Fault Injection | Custom Python harness + network chaos tooling |
| Cloud Platform | AWS |
| Cluster Management | kubectl · Kubernetes Python client |
| Output Format | Structured JSON evaluation logs |